
Kalshi event contract interface showing real-time pricing, bid-ask spreads, trading volume, and historical price movement for an economic policy outcome

Using Kalshi Market Analytics for Research and Forecasting: Extracting Signals from Contract Data

A political analyst tracking congressional spending votes, an economist monitoring recession probabilities, or a technology journalist following AI regulation debates faces a common problem: translating public opinion polls, expert commentary, and scattered data into a coherent forecast. Traditional sources often lag, reflect selective sampling, or depend on closed methodologies. Kalshi’s regulated prediction market platform offers a different kind of signal—one derived from real-time trading activity, where participants commit capital to their beliefs about specific, measurable outcomes. The resulting contract prices and trading volumes reflect aggregated probability estimates that can inform research, reporting, and strategic planning.

The value of market-derived signals lies not in perfect accuracy, but in transparency and granularity. Event Contracts on Kalshi define outcomes explicitly, settle according to objective criteria, and trade continuously until resolution. That structure produces market analytics that reveal where collective attention and capital are concentrated, how confidence in an outcome shifts as new information arrives, and which events attract sustained interest from informed participants. For researchers and analysts, this data offers a complement to traditional forecasting methods—a way to incorporate crowd intelligence without abandoning critical judgment or domain expertise.

Kalshi event contract interface showing real-time pricing, bid-ask spreads, trading volume, and historical price movement for an economic policy outcome

How real-time pricing encodes probability estimates

On a regulated prediction market, contract prices serve as probability estimates because the payout structure aligns incentives. A contract trading at $65 means the market collectively assesses a 65 percent probability of the specified event occurring—assuming efficient pricing and sufficient liquidity. That price emerges from continuous trading between buyers and sellers, each updating their estimates based on new information, analysis, or simply changed conviction. When a major news event breaks, the price response can be immediate; when uncertainty persists, trading volumes may shrink and spreads may widen.

The accuracy of these estimates depends on several conditions. First, market participants must understand the resolution criteria and believe they are applied fairly. Ambiguity about what counts as resolution—whether a statement qualifies, how rounding works, what time zone applies—can suppress trading and inflate uncertainty premiums. Second, the event must be consequential enough to attract participants with expertise or access to relevant information. A niche policy question might trade at wide spreads with low volume, making the price less reliable. Third, the market must remain liquid enough for new information to move the price quickly rather than getting stuck until a large participant decides to trade.

For a journalist or analyst using market analytics to inform a story or forecast, this means examining three metrics alongside the headline price. Trading volume indicates confidence and information flow; sharp price moves on low volume may reflect sudden changes in liquidity rather than genuine new evidence. Bid-ask spreads show the cost to trade and often correlate with uncertainty; wider spreads suggest participants are less certain and less willing to provide liquidity. Price history reveals whether the contract has drifted steadily or moved sharply, which can indicate accumulating information or a specific catalyst. A price that suddenly jumped from 35 to 55 tells a different story than one that has been climbing gradually from 35 to 55 over weeks.

The Kalshi exchange makes these data points auditable and accessible, allowing researchers to review historical prices, trading patterns, and order flow without relying on proprietary modeling or opaque methodologies. That transparency is valuable precisely because it enables verification and critical analysis rather than blind acceptance of a single number.

Using volume and spread data for signal confidence assessment

Not every contract price deserves equal weight in decision-making. Volume and spread metrics help distinguish between well-calibrated estimates and speculative noise. A contract trading at $72 with a two-cent bid-ask spread and five hundred thousand dollars in daily volume represents a market where many participants are willing to commit capital and accept tight execution. The same $72 price on a contract with a twenty-cent spread and ten thousand dollars in volume may reflect the conviction of a small group or someone betting with limited capital.

Researchers can use market analytics to construct a confidence score. A simple model might weight the price by a liquidity measure—volume divided by spread, for example—to identify which forecasts should carry the most influence. This is not a mechanical process; it requires judgment about whether high volume indicates genuine information or merely speculative churn. A well-publicized contract on a major election might show high activity simply because it attracts casual traders, whereas a more technical contract about regulatory timelines might trade less frequently but involve better-informed participants.

Time-weighted metrics are equally important. Market analytics that track how prices change across different phases—before a major announcement, immediately after, and in the following days—can reveal whether participants are updating rationally. A contract that spikes and then reverses may indicate emotional trading or the arrival of new information that initially seemed important but proved less relevant. One that moves steadily and holds its level may suggest more deliberative reassessment. Neither pattern is inherently more trustworthy, but the shapes tell different stories about what the market is responding to.

For practical application, an analyst can establish a minimum threshold for volume and maximum threshold for spreads before relying on a contract’s price signal. This discipline prevents mistaking illiquid markets for accurate forecasts. A contract with strong volume but widening spreads may indicate uncertainty increasing as new information becomes available—a signal worth noting separately from the price itself.

Comparing contract prices with other data sources and forecasts

Market-derived probabilities are one input, not the final answer. Comparing Kalshi contract prices with expert surveys, historical base rates, model outputs, and journalistic reporting can reveal where consensus breaks down and where the market is priced to an assumption that other sources question. If a contract on GDP growth is trading at 58 while leading economic models suggest 45 and recent surveys show 52, that divergence warrants investigation.

Several patterns emerge from comparative analysis. Sometimes the market is ahead—the contract price moves before official data are released, suggesting informed traders have better information or stronger analytical frameworks. Sometimes the market lags because of network effects; participants may anchor to recent or widely publicized forecasts rather than updating independently. Sometimes the market reflects a different weight on uncertainty; a contract price of 50-50 might mean genuine ambiguity, or it might mean the market is pricing in one outcome heavily but the probability of a binary misresolution or ambiguous criteria keeps prices centered.

Journalists and policy researchers can use this comparative lens to structure interviews and investigations. If market analytics show a contract at odds with expert consensus, asking why becomes the reporting question rather than assuming one side must be wrong. Markets incorporate information that experts may not have considered; experts have domain knowledge that markets might discount. The goal is not to choose sides but to understand what each source is assuming and where those assumptions differ.

Publishing a story that notes a forecast disagreement—”experts expect 40 percent probability while traders on Kalshi’s prediction market are pricing 62 percent”—provides readers with multiple perspectives and transparency about methodology. It also invites them to form their own judgment rather than presenting a single expert view as definitive.

Tracking probability shifts as new information arrives

One of the most useful applications of market analytics is observing how participants update their beliefs in response to specific events. When a government agency announces a policy decision, when earnings are reported, when legislation passes or fails, the contract price should adjust. Tracking these movements provides a timestamped record of how the market interpreted each piece of information.

An analyst can construct a event study by identifying the exact time a major announcement occurred and recording the contract price before and after. If a contract on trade tariffs moves from 38 to 71 in five minutes following a presidential statement, that reflects the market’s collective reassessment of the probability. The size of the move indicates how much uncertainty the announcement resolved; a move from 38 to 39 suggests the news was already expected, while a 30-point jump indicates genuine surprise or revelation.

Comparing move sizes across different contracts can also reveal connections. If tariff contracts move sharply but currency-market contracts barely move, that might suggest traders believe the tariff outcome is genuine but the currency impact is already priced in elsewhere. If both move together, the market is assessing a broader economic shift. This kind of cross-contract analysis is possible on Kalshi because the platform’s transparent structure lets researchers examine multiple related contracts and their price dynamics.

For longer-term forecasts—economic growth over the next year, technology adoption milestones, or regulatory outcomes over months—charting the price path month-by-month or week-by-week can reveal whether the market’s confidence is increasing, decreasing, or cycling. A price that climbs steadily from 25 to 75 over six months tells a story of accumulating evidence. A price that oscillates between 45 and 55 suggests fundamental uncertainty or conflicting signals that the market cannot resolve.

Building forecasting models that incorporate market signals

Researchers with quantitative capabilities can combine market analytics with other variables to build ensemble forecasts. A simple approach is to treat the Kalshi contract price as one predictor among several. If a model uses historical base rates, recent polling data, expert surveys, and economic indicators, adding the market price as an additional input can improve accuracy because the market aggregates information from many participants and updates continuously.

The weighting of market signals within a model depends on the domain and the track record of the specific contract. Some markets on prediction platforms are notoriously accurate—election contracts, for example, often outperform polls by the closing date. Others are noisier because the event is harder to predict or the market is less liquid. An analyst building a model can track the historical accuracy of a Kalshi contract over previous similar outcomes, then weight it accordingly in a new forecast.

More sophisticated approaches can account for contract-specific factors. A contract with widening spreads might be weighted less than one with stable liquidity, reflecting the lower confidence in the price signal. A contract whose price has been volatile might receive different weight than one that has been stable, depending on whether volatility indicates good information or noise. These adjustments require judgment and testing against historical data, but they can improve overall forecast quality.

For journalists and non-technical analysts, the simpler approach is transparent: acknowledge that the forecast incorporates market analytics, explain what the contract price is and how many people are trading it, and note what other sources suggest. A statement such as “current probability according to Kalshi traders is 63 percent, while economic forecasters surveyed by X estimate 55 percent” provides readers with the data and the reasoning without claiming mathematical authority that the analyst may not possess.

Identifying research gaps through market interest and contract design

Market analytics on Kalshi can also indicate where forecasting gaps exist or where participant attention is concentrated. If a dozen contracts exist on Federal Reserve interest-rate decisions but none on the inflation trajectory they might produce, that reflects a market gap. If multiple contracts trade briskly on AI policy but volumes are low on AI safety outcomes, that reveals where collective capital is focused versus what might deserve attention.

Researchers can use this market intelligence to identify reporting opportunities or research questions. If traders are pricing a 70 percent chance of a regulatory decision but little market-based probability exists for downstream effects, an analyst might investigate and publish that gap. If a contract shows high volume but consistently appears to misprice relative to fundamentals (as measured by subsequent resolution), that might indicate a systematic bias worth documenting.

The contract design itself—what events Kalshi chooses to list—reflects the platform’s view of what matters. Economic data, elections, and major policy decisions attract contracts because they are clearly defined and easily resolved. More ambiguous or longer-duration outcomes are harder to specify and resolve, so fewer contracts exist for them. An analyst reviewing available contracts learns something about the boundaries of predictable, observable outcomes versus those that remain in the realm of narrative and interpretation.

This intelligence can sharpen research questions. Rather than asking “what will happen with AI regulation,” a researcher might ask “what specific regulatory milestones does the market believe are likely, and do those forecasts align with expert opinion on the most important regulatory risks?” Market analytics force specificity because contracts require explicit event definitions and resolution criteria.

Practical pitfalls and limitations of market-based forecasting

Market analytics are powerful but bounded. The most important limitation is that real-time pricing reflects the beliefs of participants with capital and willingness to trade, not necessarily the beliefs of informed experts or the broader public. A market can be wrong, sometimes systematically. Kalshi’s regulated structure provides oversight and auditable records, but regulation does not guarantee accuracy.

Selection bias is another concern. Participants who trade on Kalshi may differ systematically from the general population; they may be more informed, more risk-tolerant, or simply have different priors. A contract might price high because sophisticated traders have information, or because a few confident-but-mistaken participants are dominating the trading. Without knowing the composition of participants, it is difficult to assess which is happening.

Liquidity droughts can strike suddenly. A contract might have been heavily traded for weeks, then see volume collapse if a news event seems to resolve the uncertainty or if participants shift capital to newer, more uncertain outcomes. An analyst relying on market analytics should refresh their data regularly and avoid assuming that historical trading patterns will persist.

Finally, markets are not immune to cascades and herding. A price move can trigger stop-loss orders or algorithmic trading that amplifies the move regardless of whether the underlying information justifies it. Examining the time-series of prices and comparing them to exogenous news can help distinguish genuine information updates from technical trading, but this requires care and often a degree of domain expertise that the analyst must bring independently.

Structuring research reports that reference market signals

When incorporating Kalshi market analytics into published research or journalism, clear attribution and methodology matter. A responsible approach includes stating the contract price, the date it was observed, the bid-ask spread and volume at that time, and the explicit event definition. For example: “As of June 15, traders on Kalshi’s prediction market priced a 58 percent probability of the Federal Reserve cutting rates by 50 basis points at its July meeting, based on a contract with $2.3 million in daily volume and a three-cent spread.”

Providing this context allows readers to assess the signal’s reliability and to replicate the analysis if desired. It also acknowledges uncertainty—a 58 percent market estimate is not a guarantee. If the analyst has formed an independent view that differs, stating that clearly and explaining the divergence strengthens rather than weakens the piece.

For longer reports, including a chart of the contract’s price over time can illustrate how the market’s probability estimate has evolved. This visual summary often tells more than a single snapshot. Readers can see whether a forecast has been stable or shifting, whether major events corresponded to price moves, and whether the current price represents a new consensus or a temporary swing.

The fundamental principle is transparency. Market analytics can inform forecasts and research, but they do not replace judgment, expertise, or the hard work of investigating underlying facts. Presenting them as one input among many, with clear limitations acknowledged, allows readers to understand what the market is saying and how it fits into a broader analytical picture.

Frequently asked questions

How reliable are Kalshi contract prices as probability estimates?

Kalshi contract prices reflect aggregated beliefs of market participants and can be accurate when the market is liquid, the event is clearly defined, and participants have access to relevant information. However, market analytics should be treated as one input, not as ground truth. Reliability varies by contract; highly liquid, widely followed outcomes typically offer more trustworthy signals than niche or illiquid markets. Comparing contract prices with other data sources, surveying experts, and examining historical accuracy of similar contracts can help assess how much weight to place on a given price.

What metrics should I examine alongside price when using market analytics?

Trading volume, bid-ask spreads, and price history all matter. High volume with narrow spreads typically indicates a more reliable price signal than low volume with wide spreads. Examine how the price has moved over time—has it drifted steadily or spiked suddenly?—to understand whether the current level reflects accumulated information or a reaction to a specific event. A contract with declining volume may signal that participants believe the outcome is increasingly uncertain or already resolved, affecting the quality of the market analytics.

Can I use Kalshi market analytics to build a quantitative forecasting model?

Yes. Market prices can be incorporated as features in ensemble forecasts alongside historical base rates, expert surveys, and other variables. The effectiveness depends on your domain, the historical track record of the specific contract, and how well you weight the market signal relative to other inputs. Start by testing whether adding the market price improves accuracy on past similar events, then adjust weighting accordingly. For simpler applications, transparent reporting of what the market is pricing alongside other forecasts is often sufficient.
Arbitrage Opportunities on Polymarket: Finding and Exploiting Price Inefficiencies

Prediction markets have grown fragmented across multiple platforms, each with distinct liquidity pools, user bases, and settlement mechanisms. A binary outcome—whether a political candidate wins, unemployment falls below a threshold, or a company launches a product—may trade at meaningfully different prices on Polymarket, Manifold Markets, PredictIt, and other venues simultaneously. For traders with the tools to detect and execute across these venues, those price gaps represent concrete profit opportunities, provided execution risk, gas costs, and settlement delays do not consume the margin.

The fundamental arbitrage case on Polymarket is straightforward in principle: if a YES share on a political outcome trades at 55 cents on Polymarket but 48 cents on a competing platform, and the trader can simultaneously execute both sides while managing liquidity, time, and regulatory exposure, the difference flows directly to profit. In practice, that execution requires understanding Polymarket’s specific architecture—its use of USDC stablecoin settlement, Polygon Layer-2 infrastructure, Automated Market Maker liquidity dynamics, and UMA oracle resolution. The trader who recognizes price inefficiencies but mishandles settlement timing or underestimates network congestion will find their edge consumed by slippage and delay.

How price discrepancies emerge across prediction markets

Prediction markets are not globally unified. Each platform operates on different blockchains or infrastructure, attracts different participant demographics, and implements different fee structures. Polymarket uses Polygon and charges zero trading fees to users, passing cost recovery to market creators and leveraging the network’s speed and efficiency. Other venues—PredictIt on the Ethereum mainnet with transaction costs, Manifold Markets with its own liquidity mechanics, or offshore platforms like Betfair—each have distinct economic incentives and barriers to entry.

Price discrepancies persist because of market fragmentation and information asymmetry. A sophisticated macroeconomic trader may see a specific outcome as underpriced on Polymarket relative to historical base rates or cross-market pricing, but retail participants on that platform may not have access to the same analysis or competing markets. Conversely, breaking news that affects election odds may move PredictIt faster than Polymarket if news aggregators feed directly into that audience. Liquidity varies by time of day and by market; a YES share may be expensive to acquire in size on a thinly traded Polymarket market but easier to access on Manifold, creating a temporal arbitrage window.

Regulatory uncertainty also drives wedges between markets. Polymarket restricts US retail access through gating mechanisms, whereas PredictIt operates under a specific no-action letter from the CFTC that permits certain US participation. That difference in access creates two separate participant pools with distinct risk tolerances and information sources. A political outcome may be priced more cautiously on Polymarket by international traders concerned about regulatory risk, while US-based participants on PredictIt price the same outcome more aggressively based on their local polling and media environment.

Market maturity also matters. Established markets with high volume and low spreads converge quickly; inefficiencies vanish before a trader can exploit them. Emerging markets, new questions added to a platform, or niche outcomes attract fewer participants and therefore exhibit larger bid-ask spreads and slower price discovery. A market on Polymarket for an obscure regulatory decision may trade at 60 cents on YES, while a more liquid Manifold equivalent for the same outcome has already converged to 52 cents. The trader who recognizes that discrepancy has a narrow window before others notice and trade it away.

Identifying inefficiencies: Tools and data sources

Manual price checking across platforms is slow and error-prone. The trader who opens Polymarket, navigates to a market, then manually switches to PredictIt and Manifold Markets by the time prices have already moved. Systematic arbitrage requires automated or semi-automated price monitoring. Several approaches exist, with varying levels of sophistication and legal clarity.

The simplest method is a spreadsheet or lightweight monitoring script that periodically samples prices from public APIs and exchanges. Polymarket’s subgraph, maintained on The Graph, exposes real-time market data including prices, volumes, and liquidity positions. Other platforms publish APIs or maintain accessible data endpoints. A trader can write a basic script that logs prices at fixed intervals, calculates percentage differences, and alerts when the spread exceeds a predefined threshold. That approach captures only static snapshots and misses the exact timing of price changes; it is sufficient for monitoring illiquid markets but inadequate for fast-moving outcomes.

More sophisticated systems use WebSocket connections to monitor price feeds in real time, calculate implied probabilities across markets, and generate actionable signals the moment a discrepancy appears. Some traders implement order flow aggregators that track bids and asks as they arrive, enabling them to front-run the convergence they anticipate. The legal status of such systems is ambiguous in traditional finance; in prediction markets, which are less regulated and have fewer institutional guardrails, the barriers are lower but not nonexistent.

Data quality is a practical constraint. Platform APIs can be inconsistent, downtime is common, and historical data is often incomplete. A trader relying on a single price feed for a critical decision may find that the feed lag caused them to miss the execution window or, worse, to act on stale information. Cross-referencing multiple sources—published order books, blockchain transaction data, and direct API calls—reduces that risk but also increases complexity and cost.

Execution risk and the costs of speed

Identifying a 7-cent discrepancy on a YES share is only step one. Executing the arbitrage before prices converge is step two, and it is where most theoretical profits evaporate. On Polymarket, a trader must deposit USDC into the platform, identify the market, place a buy order at current liquidity conditions, wait for confirmation, and then simultaneously execute the offsetting sale on a competing platform. Each step introduces latency, cost, and execution uncertainty.

Polygon’s speed advantage is meaningful but not infinite. A transaction to Polymarket typically confirms in seconds, but slippage can reduce the effective fill price compared to the quoted rate. The Automated Market Maker on Polymarket uses a Constant Product formula; large orders move the price against the trader, sometimes by more than the original arbitrage spread. A trader attempting to buy $10,000 of YES shares at a seemingly attractive price may encounter slippage of 200–300 basis points due to limited liquidity, reversing the profit into a loss.

Competing platform execution introduces further complications. If Polymarket settles quickly but PredictIt has network congestion, the trader may find themselves holding an unhedged YES position on Polymarket while the offsetting short sale on PredictIt sits pending. If prices move sharply in the interim—perhaps new polling data releases—that unhedged window can turn a small arbitrage into a large directional bet.

Gas costs on Layer-2 networks like Polygon are negligible compared to Ethereum mainnet, but they are not zero. A trader executing frequent small arbitrage trades across many markets may face $50 to $200 per week in aggregate network costs. That overhead is tolerable if each arbitrage captures 200 basis points, but it destroys economics if inefficiencies average only 50 basis points. The trader must therefore be selective, targeting only markets where the spread is large enough to survive slippage, network costs, and the time value of capital.

Settlement and resolution risk in arbitrage positions

Prediction market arbitrage differs from equity or derivatives arbitrage in one critical respect: the underlying “assets” settle on real-world outcomes with delays and dispute mechanisms. On Polymarket, outcomes are resolved by UMA oracles, which aggregate data from decentralized sources and allow community challenges. That mechanism is robust against single points of failure, but it introduces uncertainty about timing and finality.

A trader executing an arbitrage on election night may lock in a small spread by going long YES on Polymarket and short YES (or long NO) on Manifold, believing the outcome is certain. But election outcomes are sometimes disputed, and regulatory clarity may be unclear; disputes can extend settlement by days or weeks. During that period, the trader’s capital is locked, unable to redeploy to other arbitrages. The effective return on an annualized basis may be poor if the capital is trapped for 30 days waiting for an oracle resolution that should have been obvious in 24 hours.

UMA’s dispute mechanism also creates tail risk. In most cases, the oracle resolves correctly, and both platforms settle to the same outcome. But if a market on Polymarket resolves YES and a competing platform resolves NO—perhaps due to different data inputs or interpretation—the trader’s arbitrage collapses. Both sides of the position cannot be unwound simultaneously if the platforms disagree on the outcome. That scenario is rare, but it is not zero probability, and it represents a potential loss that can exceed the captured arbitrage profit.

Geographic and regulatory complications add another layer. Some traders participate across international prediction markets, UK betting exchanges, and decentralized platforms. Settlement rules, tax treatment, and regulatory approval vary. A trader who successfully arbitrages across three venues but faces unexpected tax liability or regulatory action in one jurisdiction may find the net profit entirely eliminated. Due diligence on jurisdiction-specific rules is therefore as important as price monitoring.

Capital efficiency and bankroll management

Arbitrage capital is locked in two places simultaneously: on Polymarket and on a competing platform. If a trader has $100,000 and identifies a 50-basis-point arbitrage opportunity, executing that opportunity fully consumes the entire bankroll, earning perhaps $500 to $1,000 after costs while tying up all capital. If the trader identifies multiple opportunities on the same day—a reasonable scenario across dozens of active markets—they face a choice: execute only the best opportunity and leave capital idle, or split capital and dilute the return on each position.

Working with leverage or external capital can multiply returns, but it also introduces counterparty risk and fees. Some traders borrow USDC at a fixed rate to increase arbitrage capital, accepting the cost as part of their cost basis. Others solicit limited partners to co-invest, sharing returns in exchange for deployed capital. Both approaches magnify small-percentage arbitrage opportunities into meaningful absolute returns, but they also magnify losses if execution goes wrong or if capital is locked longer than expected.

The practical implication is that successful prediction market arbitrage requires scale and patience. A small-scale trader executing one or two arbitrages per week may earn $100 to $500 per trade, insufficient to justify operational overhead and opportunity cost. A systematic trader who can execute 10 to 20 arbitrages per week across multiple markets, managing capital efficiently and reinvesting profits, can build a sustainable business. The mathematical edge is small—often 20 to 100 basis points per trade—but compounding and scale make it economically viable.

Regulatory and platform-specific constraints

Prediction market arbitrage operates in a legal gray zone that is shifting rapidly. The CFTC has not clearly stated whether frequent trading on prediction markets constitutes futures trading subject to exchange registration, and the regulatory treatment of decentralized platforms like Polymarket remains unsettled. In the US, Polymarket restricts retail account access; operating from a US residential address while arbitraging cross-platform may violate the platform’s terms or expose the trader to regulatory risk.

International traders face jurisdiction-specific rules. UK traders may be subject to Gambling Commission oversight, while EU traders must navigate MiFID II and national derivatives regulations. Some traders operate from jurisdictions with minimal regulation—Singapore, Cayman Islands, or the UAE—to reduce regulatory friction. That approach trades lower regulatory burden for reduced access to traditional financial infrastructure and less recourse if a dispute arises.

Platform-specific constraints also limit arbitrage strategies. Some platforms implement position limits to prevent market manipulation; a trader who attempts to buy too many YES shares on a single market may face reduced liquidity or temporary restrictions. Some platforms require minimum holding periods before withdrawal, effectively locking arbitrage proceeds. Polymarket’s terms explicitly restrict certain forms of account activity; high-frequency trading or suspected arbitrage bots may trigger account review or suspension. A trader should thoroughly review each platform’s terms of service and contact support before deploying large capital.

Building a systematic approach to prediction market arbitrage

Successful arbitrage is not a single trade; it is a system of monitoring, filtering, execution, and risk management. A trader building a systematic approach should start with the following framework. First, establish a price monitoring system that samples multiple platforms at regular intervals and calculates spreads automatically. Second, set minimum spread thresholds—only signal trades if the opportunity exceeds a profitable hurdle rate after fees, slippage, and settlement delays. Third, pre-position capital on each platform in sizes appropriate to historical arbitrage volumes, reducing the need to deposit or withdraw during execution windows.

Fourth, implement position-level risk controls. Do not arbitrage more capital than necessary in single trades; keep positions small enough that market impact is negligible and execution risk is manageable. Fifth, maintain detailed records of every executed arbitrage, including the prices at entry and exit, settlement outcomes, and actual realized profit or loss. Over time, that data reveals which market pairs are most reliable, which platforms have consistent slippage, and which spreads are most likely to close before execution.

Sixth, periodically backtest trading rules on historical data to verify that signaling logic actually captures value. A system that looks good in real time may simply be chasing noise if the spreads were never real or closed too quickly to execute profitably. Seventh, expect and plan for occasional losses. Execution errors, market impact, or unexpected price moves will sometimes result in negative trades. The goal is to ensure that winning trades outnumber and outsize losing trades by a sufficient margin to generate positive expected value over a large sample.

Finally, recognize that prediction market arbitrage is a commodity strategy. As more traders automate detection and execution, spreads compress, and returns diminish. A trader who discovers an arbitrage opportunity today may find that opportunity has been closed by competing automated systems within hours or days. Staying ahead requires continuous system refinement, faster execution infrastructure, or moving into less crowded market niches where competition is lighter. The most durable edge comes from identifying inefficiencies that others miss—markets with limited participation, outcomes that span multiple platforms but attract different trader demographics, or settlement mechanics that create persistent timing gaps.

Frequently asked questions

What is the typical size of arbitrage opportunities on Polymarket?

Price discrepancies vary widely by market liquidity and platform fragmentation. Highly liquid markets on Polymarket with deep volume on competing platforms may exhibit spreads of 10 to 50 basis points; illiquid or niche markets can show spreads of 100 to 300 basis points or more. After accounting for slippage, network costs, and execution delays, profitable opportunities typically require spreads of at least 75 to 150 basis points to deliver positive expected return.

How does Polygon’s low-cost infrastructure affect arbitrage strategy on Polymarket?

Polygon’s Layer-2 scaling reduces gas costs from hundreds of dollars per transaction to cents, enabling frequent trading and small-spread arbitrage that would be economically infeasible on Ethereum mainnet. This makes Polymarket attractive for high-frequency arbitrage strategies, but it also means that competing arbitrageurs can execute quickly, causing spreads to compress faster than on more expensive networks.

What happens if different platforms resolve a market to different outcomes?

Resolution discrepancies are rare but possible if platforms use different data sources or UMA oracle interpretations. If Polymarket resolves a market to YES while a competing platform resolves to NO, an arbitrage position spanning both platforms will realize a loss on one side that cannot be offset by a gain on the other. The trader is exposed to basis risk—the risk that the two sides of a supposedly hedged trade diverge due to different settlement rules or oracle behavior.

Urgent Hiring

🔔 URGENT HIRING – MULTIPLE POSITIONS | KSA & QATAR

Mancon International PVT Ltd. is pleased to announce immediate openings for experienced professionals with a leading employer in KSA and Qatar. Candidates with strong backgrounds in construction, steel fabrication, interior design, e-commerce, and sales are encouraged to apply.
📌 CURRENT VACANCIES – DETAILED REQUIREMENTS

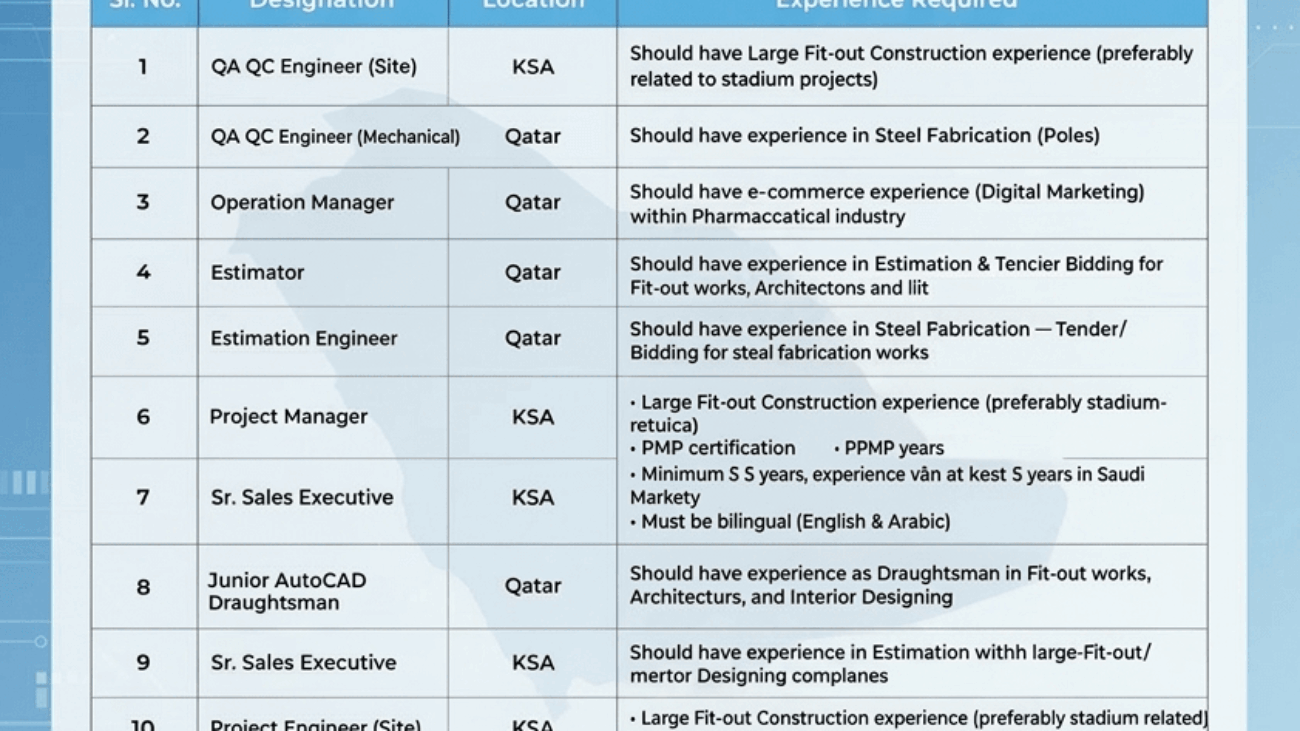
1 QA QC Engineer (Site) KSA Should have large Fit-out Construction experience (preferably related to stadium projects)
2 QA QC Engineer (Mechanical) Qatar Should have experience in Steel Fabrication (Poles)
3 Operation Manager Qatar Should have e-commerce experience (Digital Marketing) within the Pharmaceutical industry
4 Estimator Qatar Should have experience in Estimation & Tender Bidding for Fit-out works, Architecture, and Interior Designing
5 Estimation Engineer Qatar Should have experience in Steel Fabrication – Tender/Bidding for steel fabrication works
6 Project Manager KSA • Large Fit-out Construction experience (preferably stadium-related)
• PMP certification mandatory
• Minimum 15 years of experience as Project Manager
• Must be bilingual (English & Arabic)
7 Junior AutoCAD Draughtsman Qatar Should have experience as Draughtsman in Fit-out works, Architecture, and Interior Designing
8 Sr. Sales Executive KSA • Experience as Sales Executive within large Fit-out/Interior Designing companies
• Minimum 5–7 years’ experience (with at least 5 years in Saudi Market)
• Must be bilingual (English & Arabic)
9 Sales Manager KSA • Experience as Sales Manager within large Fit-out/Interior Designing companies
• Minimum 10 years’ experience (with at least 5 years in Saudi Market)
• Must be bilingual (English & Arabic)
10 Project Engineer (Site) KSA • Large Fit-out Construction experience (preferably stadium-related)
• Minimum 10 years of experience in Project Planning
• Must be bilingual (English & Arabic)
✨ GENERAL BENEFITS (Varies by Position)
Competitive tax-free salary
Food, accommodation, and transport as per company policy
Overtime eligible (subject to site requirements)
Annual leave and air ticket as per the labor law
Full visa sponsorship
📩 HOW TO APPLY
📧 Email: careers@manconint.com
📱 Phone / WhatsApp: +92 321-472-9065
🌐 Website: www.manconint.com

Subject Line: Application for [Position Title] – [KSA/Qatar]